
Benchmarking DCI in Ruby
I’ve recently become quite intrigued with the concepts behind DCI (Data Context and Interaction). I won’t go too in depth about what DCI is or why you might use it, that’s been discussed many times elsewhere. In short, DCI is an architecture which allows us to delineate our domain objects from the actual functions they perform. It mixes-in Roles (functionality) into our Data component when and only when that functionality it needed; when in Context. Most of the value DCI brings to the table derives from the way it forces you to abstract out behavior into testable modules.
What I’d like to do is take a look at the performance implications of using DCI in Ruby applications.
I think it should be said upfront that this is purely academic and may have minimal bearing within the ecosystem of a complex app. For this sake, I won’t try to draw any vast conclusions.
How to use DCI in Ruby
DCI can be used in Ruby by augmenting your objects with Roles at runtime so that the necessary interactions are available to that object.
class User
  ...
end

module Runner
  def run
    ...
  end
end

user = User.new
user.extend Runner
user.run
In more traditional, idiomatic Ruby you would normally just include the module while defining the class:
class User
  include Runner
  ...
end

user = User.new
user.run
Hypothesis
Since every #extend called carries some memory and processing implications, lately I’ve been wondering if, while using DCI, we could be incurring a performance hit when extending many objects ad hoc. I decided to profile this to understand if we could be blindly degrading performance and whether there are optimization techniques I should be aware of.
My process involves taking the most simplified example (shown in the above snippets) and benchmarking the traditional approach against the DCI-inclined approach.
I’m running these benchmarks on a MacBook Pro - 2.2 GHz - 8 GB memory.
The Runner Module
Here’s the Runner module used in the following examples. It’s just one method that does some arbitrary calculation.
runner.rb
module Runner
  def run
    Math.tan(Math::PI / 4)
  end
end
Ruby Benchmark
Using Ruby’s Benchmark library, we can extrapolate the amount of time taken for these processes to execute. First, we’ll benchmark the traditional, idiomatic Ruby way: using an include to augment the class.
include_bm.rb
require 'benchmark'
require './runner'

class IncludeUser
  include Runner
end

Benchmark.bm do |bench|
  3.times do
    bench.report('include') do
      1000000.times do
        user = IncludeUser.new
        user.run
      end
    end
  end
end
$ ruby include_bm.rb
       user     system    total     real
include  0.500000   0.000000   0.500000 (  0.497114)
include  0.500000   0.000000   0.500000 (  0.497363)
include  0.490000   0.000000   0.490000 (  0.497342)
The results of this benchmark tell us that executing 1 million “run” operations results in roughly 0.5 seconds.
Let’s look at how this compares to the DCI implementation.
dci_bm.rb
require 'benchmark'
require './runner'

class DCIUser; end

Benchmark.bm do |bench|
  3.times do
    bench.report('DCI') do
      1000000.times do
        user = DCIUser.new
        user.extend Runner
        user.run
      end
    end
  end
end
$ ruby dci_bm.rb
      user     system    total     real
DCI  8.430000   0.000000   8.430000 (  8.429382)
DCI  8.490000   0.010000   8.500000 (  8.486804)
DCI  8.450000   0.010000   8.460000 (  8.447363)
Quite a difference! It’s probably safe to say at this point that calling extend 1 million times is a lot less performant than including the module one time as the class is defined. The reasoning is simple. Including the module once injects it in the user objects’ lookup hierarchy. When the run method is called, the hierarchy is traversed and the method is fetched. In the traditional (include) approach, the module never leaves or reenters the hierarchy after it’s been defined. Conversely, in DCI, the module enters the hierarchy each time extend is called.
Let’s profile these two approaches and discover why they’re so different.
perftools.rb
Assuming the same class/module structure as above, let’s use perftools.rb to profile their execution. Using perftools.rb is a two-step process. First, generate the profile: a summary of where the code is spending it’s time. Second, display the profile in the designated format. To visualize the components, we’ll genereate graphs using the GIF format. You’ll need the dot tool in order to generate graphs. Check out this presentation for more info on using perftools.rb.
Let’s first observe the traditional approach:
include_profile.rb
require 'perftools'
require './runner'

class IncludeUser
  include Runner
end

PerfTools::CpuProfiler.start('/tmp/include_profile') do
  1000000.times do
    user = IncludeUser.new
    user.run
  end
end
$ ruby include_profile.rb
$ pprof.rb --gif /tmp/include_profile > include_profile.gif
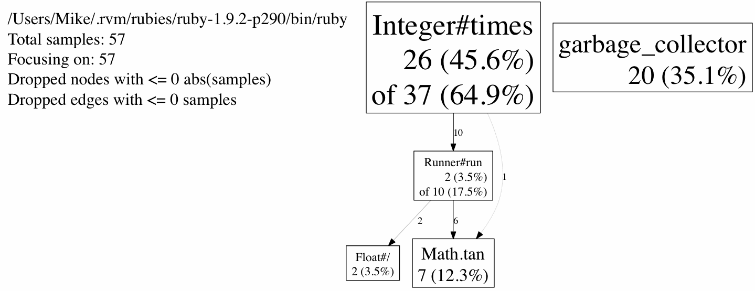
The above graph tell us that most of the execution time is happening in the iteration of our test loop. Barely any time is spent creating the objects or executing the arbitrary math calculation. More info on reading the pprof.rb output can be found here.
Now let’s take a look at the DCI approach:
dci_profile.rb
require 'perftools'
require './runner'

class DCIUser; end

PerfTools::CpuProfiler.start('/tmp/dci_profile') do
  1000000.times do
    user = DCIUser.new
    user.extend Runner
    user.run
  end
end
$ ruby dci_profile.rb
$ pprof.rb --gif /tmp/dci_profile > dci_profile.gif
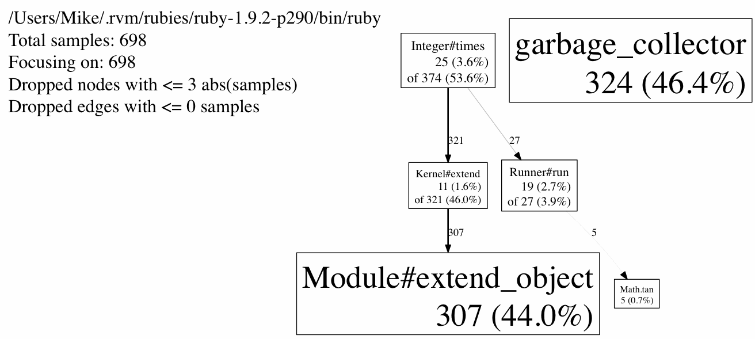
The above results tell us that almost half the time is spent extending objects at runtime through Module#extend_object. In this example, the time spent iterating over our test case is dwarfed against the time taken to extend objects. So, after profiling we can verify that extending the object is indeed taking up most of our time.
ObjectSpace.count_objects
Let’s compare how the number of objects in memory stack up with the two implementations. Ruby 1.9 provides us with the ObjectSpace.count_objects method to inspect all objects currently initialized in memory. It’s important to turn off garbage collection as it may be invoked mid-test, skewing the results. Here is the module used to inspect the number of objects currently in memory. It’s a modified version of Aaron Patterson’s implementation.
allocation.rb
module Allocation
  def self.count
    GC.disable
    before = ObjectSpace.count_objects
    yield
    after = ObjectSpace.count_objects
    after.each { |k,v| after[k] = v - before[k] }
    GC.enable
    after
  end
end
This method turns off the garbage collector, records the number of objects pre-benchmark, runs the benchmark, records the number of objects post-benchmark, then compiles the difference between the two. Let’s gather more information by exracting object allocations.
include_space.rb
require './runner'
require './allocation'

class IncludeUser
  include Runner
end

p(Allocation.count do
  1000000.times do
    user = IncludeUser.new
    user.run
  end
end)
$ ruby include_space.rb
{:TOTAL=>2995684, :FREE=>-4344, :T_OBJECT=>1000000, :T_CLASS=>0, :T_MODULE=>0, :T_FLOAT=>2000000, :T_STRING=>27, :T_REGEXP=>0, :T_ARRAY=>0, :T_HASH=>1, :T_BIGNUM=>0, :T_FILE=>0, :T_DATA=>0, :T_COMPLEX=>0, :T_NODE=>0, :T_ICLASS=>0}
Most of the keys in the printed hash refer to Ruby types. The ones we’re interested in are :TOTAL, :T_CLASS, :T_ICLASS. The meaning of these keys isn’t very well documented but the Ruby source hints at them. Here’s my understanding:
:TOTAL is the total number of objects present in memory. :T_CLASS is the total number of classes that have been declared (in memory). :T_ICLASS is the total number of internal use classes, or iClasses, used when modules are mixed in.
The DCI approach:
dci_space.rb
require './runner'
require './allocation'

class DCIUser; end

p(Allocation.count do
  1000000.times do
    user = DCIUser.new
    user.extend Runner
    user.run
  end
end)
$ ruby dci_space.rb
{:TOTAL=>4995536, :FREE=>-4492, :T_OBJECT=>1000000, :T_CLASS=>1000000, :T_MODULE=>0, :T_FLOAT=>2000000, :T_STRING=>27, :T_REGEXP=>0, :T_ARRAY=>0, :T_HASH=>1, :T_BIGNUM=>0, :T_FILE=>0, :T_DATA=>0, :T_COMPLEX=>0, :T_NODE=>0, :T_ICLASS=>1000000}
Let’s looks at the significant differences between the two:
# Include
{:TOTAL=>2995684, :FREE=>-4344, :T_CLASS=>0, :T_ICLASS=>0}

# DCI
{:TOTAL=>4995536, :FREE=>-4492, :T_CLASS=>1000000, :T_ICLASS=>1000000}
These results expose a few facts about the two implementations.
- The DCI approach uses roughly 40% more objects in memory.
- The DCI approach initializes many more classes and internal (mixed-in) classes.
Wrapping It Up
As I said at the beginning, it’s quite hard to determine how, if at all, using DCI will affect the performance of a real world application. Certainly, a single web request will never invoke 1 million inclusions of a module at runtime.
What this does show us is that Ruby is not optimized for this architecture. In idiomatic Ruby, modules are usually included during the class definition. It’s possible that languages, like Scala, with built-in tools to extend objects ad hoc perform better than Ruby. Scala’s traits provide high-level support for this type of functionality and are optimized for use with DCI.
I’m still quite interested in DCI. Specifically, in optimizations for Ruby. I’m also quite interested in running these benchmarks against a production app, something that’ll just have to wait.
All the code used here can be found on github.
Happy benchmarking!
27 comments